Milestones of the Dow Jones Industrial Average with Real Value and Chart (Checked in 2024)
A short history of the Dow Jones index, as well as its main milestones.

Why Dow Jones in this Blog?
On September 24, 2024, the 300th anniversary of the Paris Stock Exchange is being celebrated. This date made me wonder if there is something from the treasury of list books that could help commemorate this date. The lists about France are not particularly abundant, but I found a book on finance.
The author, Louis Rukeyser, was a radio and television host for over thirty years. He hosted the show Wall $treet Week with Louis Rukeyser [1]. The show's title speaks for itself — it focused on financial news. Moreover, in the 1980s, the show had more listeners than Wall Street Journal had readers [2].
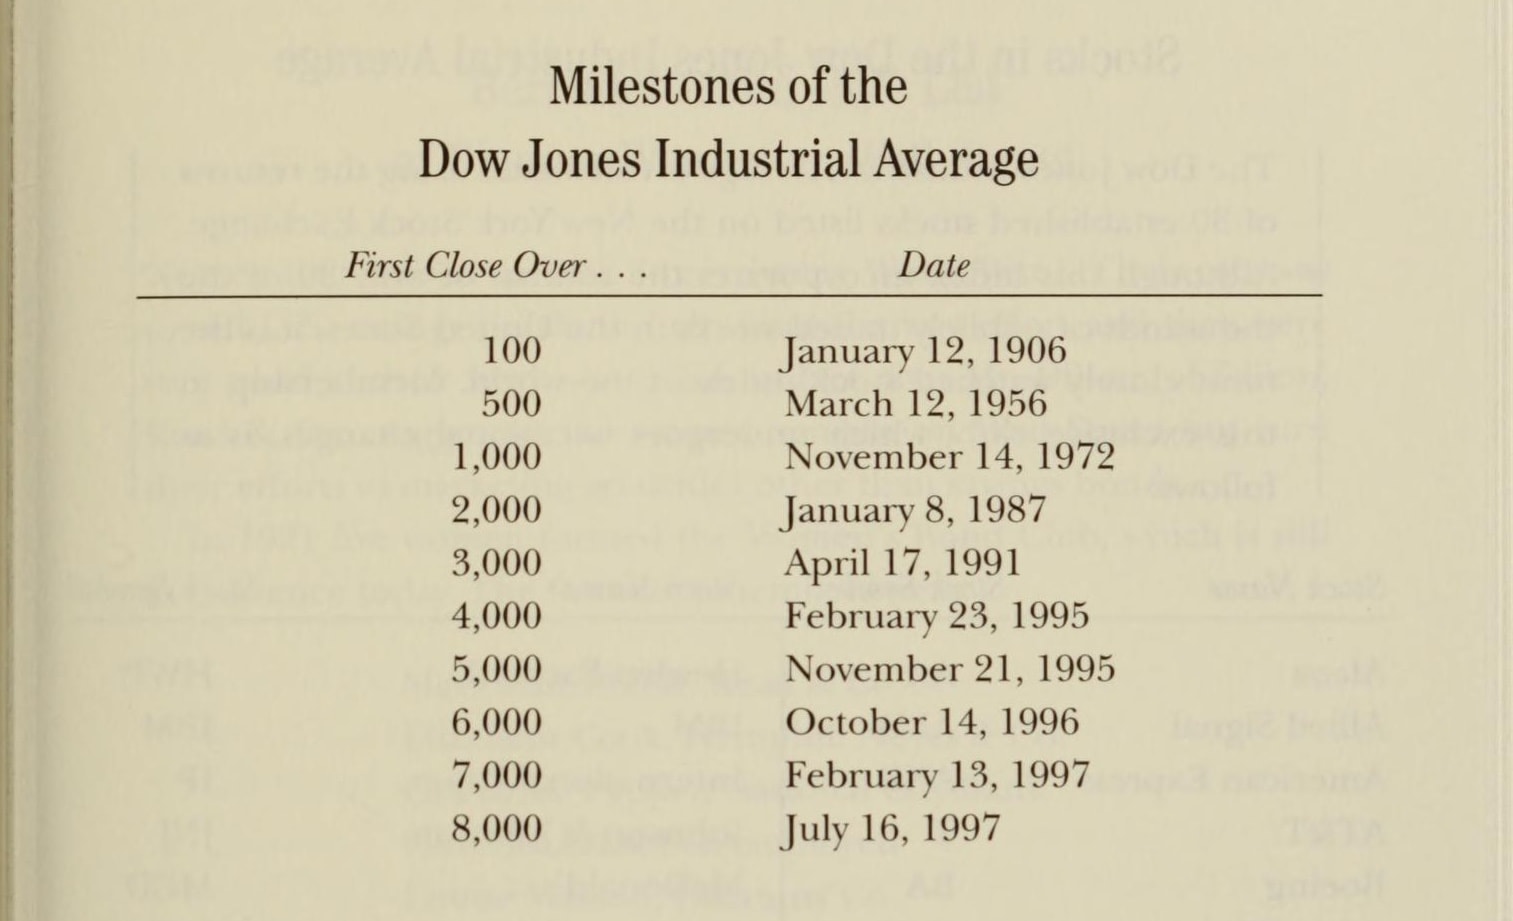
In Louis Rukeyser’s book “Louis Rukeyser’s Book of Lists” [3], there is a list dedicated to the milestones in the history of the Dow Jones Industrial Average, the most famous of the Dow Jones indices. This is the list we will explore and significantly expand upon. The latest milestone mentioned in the book is July 16, 1997. A lot has changed since then.
What is Dow Jones Industrial Average?
The Dow Jones Industrial Average (DJIA), as it is fully called, reflects the average price of the shares of the 30 largest U.S. companies traded either on New York Stock Exchange or NASDAQ [4].
How is it calculated? A meticulous reader might notice that no matter how you calculate the arithmetic mean for numbers ranging from 21 (the lowest price, Intel Corporation shares) to 577 (the highest price, UnitedHealth shares), you won't arrive at today's value of $42,000. The secret lies in the divisor known as the Dow Divisor. It accounts for various mergers, acquisitions, and other disruptions. The exact value of the Dow Divisor is not disclosed [5], although it can be estimated indirectly (≈0.1524).
The word “industrial” in the name might mislead one to think that the index is composed entirely of companies from the industrial sector. However, nowadays, it’s not necessary to mine coal or smelt metals to make it onto this pedestal of the American stock market. Today, the index includes companies like Coca-Cola, Microsoft, and Johnson & Johnson, among non-industrial others.
A Brief History of the Dow Jones Index
The Dow Jones Index was introduced in the late 19th century by Dow Jones & Company. It was proposed by Charles Dow, the editor of the Wall Street Journal. His name appears first in the index's title. His partner, Edward Jones, contributed his surname to the second part of the name.
The originally published version of the index included 12 companies, such as the “American Cotton Oil Company”, “Laclede Gas Light Company”, and “Tennessee Coal, Iron and Railroad Company”. Why do these names sound unfamiliar? The reason is that these companies no longer exist. The only survived company from the original list is General Electric, but it has been excluded from the index since 2018.
In 1916, the Dow Jones Index began including 20 companies, and on October 1, 1928, it was expanded to 30, which continues to this day. Today, Dow Jones & Company, which publishes the index, is part of News Corp. You can check the current state of index on the New York Stock Exchange website. The companies included in the index can be found here.
The Dow Jones Index is sometimes criticized for including too few companies. Therefore, investors usually pay attention to the S&P 500, which is calculated based on prices of stocks of 500 USA companies.
The Milestones in the History of the Dow Jones Index
In Louis Rukeyser's 1997 book, 10 milestones are listed: from $100 to $8,000, the maximum at that time. Interestingly, 1997 had two milestones. The first milestone in the book occurred in 1906, 91 years prior.
What does a milestone mean? It indicates that a trading day ended with Dow closed above a significant round number for the first time. For example, on April 17, 1991, the Dow Jones Index closed above $3,000 for the first time in its history.
It’s well known that $100 in 1906 is very different from $100 in 2024. Therefore, the original list will be supplemented with so-called real money values relative to 1906. These are dollars adjusted for inflation. The CPI Inflation Calculator helped calculate these values.
- January 12, 1906: $100, $100
- March 12, 1956: $500, $165
- November 14, 1972: $1,000, $215
- January 08, 1987: $2,000, $158 (Yes, there was significant inflation over those 15 years!)
- April 17, 1991: $3,000, $198
- February 23, 1995: $4,000, $236
- November 21, 1995: $5,000, $295
- October 14, 1996: $6,000, $344
- February 13, 1997: $7,000, $393
- July 16, 1997: $8,000, $449
- April 06, 1998: $9,000, $497
- March 29, 1999: $10,000, $540
- May 03, 1999: $11,000, $594
- October 19, 2006: $12,000, $536
- April 25, 2007: $13,000, $564
- July 19, 2007: $14,000, $608
- May 07, 2013: $15,000, $580
- November 21, 2013: $16,000, $618
- July 03, 2014: $17,000, $646
- December 23, 2014: $18,000, $684
- November 22, 2016: $19,000, $712
- January 25, 2017: $20,000, $734
- March 01, 2017: $21,000, $771
- August 02, 2017: $22,000, $808
- October 18, 2017: $23,000, $844
- November 30, 2017: $24,000, $881
- January 04, 2018: $25,000, $896
- January 17, 2018: $26,000, $931
- July 11, 2019: $27,000, $950
- November 15, 2019: $28,000, $986
- January 15, 2020: $29,000, $1,008
- November 24, 2020: $30,000, $1,043
- January 07, 2021: $31,000, $1,030
- March 10, 2021: $32,000, $1,063
- March 17, 2021: $33,000, $1,096
- April 15, 2021: $34,000, $1,129
- July 23, 2021: $35,000, $1,162
- November 02, 2021: $36,000, $1,196
- December 13, 2023: $37,000, $1,093
- January 22, 2024: $38,000, $1,086
- February 22, 2024: $39,000, $1,115
- May 17, 2024: $40,000, $1,144
- July 17, 2024: $41,000, $1,172
- September 19, 2024: $42,000, $1,201
How to Understand This List?
Let's look at one of the entries, for example, the last one. Few days before this post was published, the Dow Jones Index closed above $42,000 for the first time in its history. Let’s imagine this sum in our pocket.
Now, imagine we have a time machine that takes us to the desired year but adjusts our pocket money for the inflation that has occurred. If we were to travel back to 1906 with this machine, we would find $1,201 in our pocket.
One could ponder the accuracy of such a comparison for a long time, as you couldn’t buy today’s goods in 1906, but we won't dwell on that. I'll just present an illustration that compares the nominal values of the index, $42,000 in our example, with the real values, which in this example is $1,201.
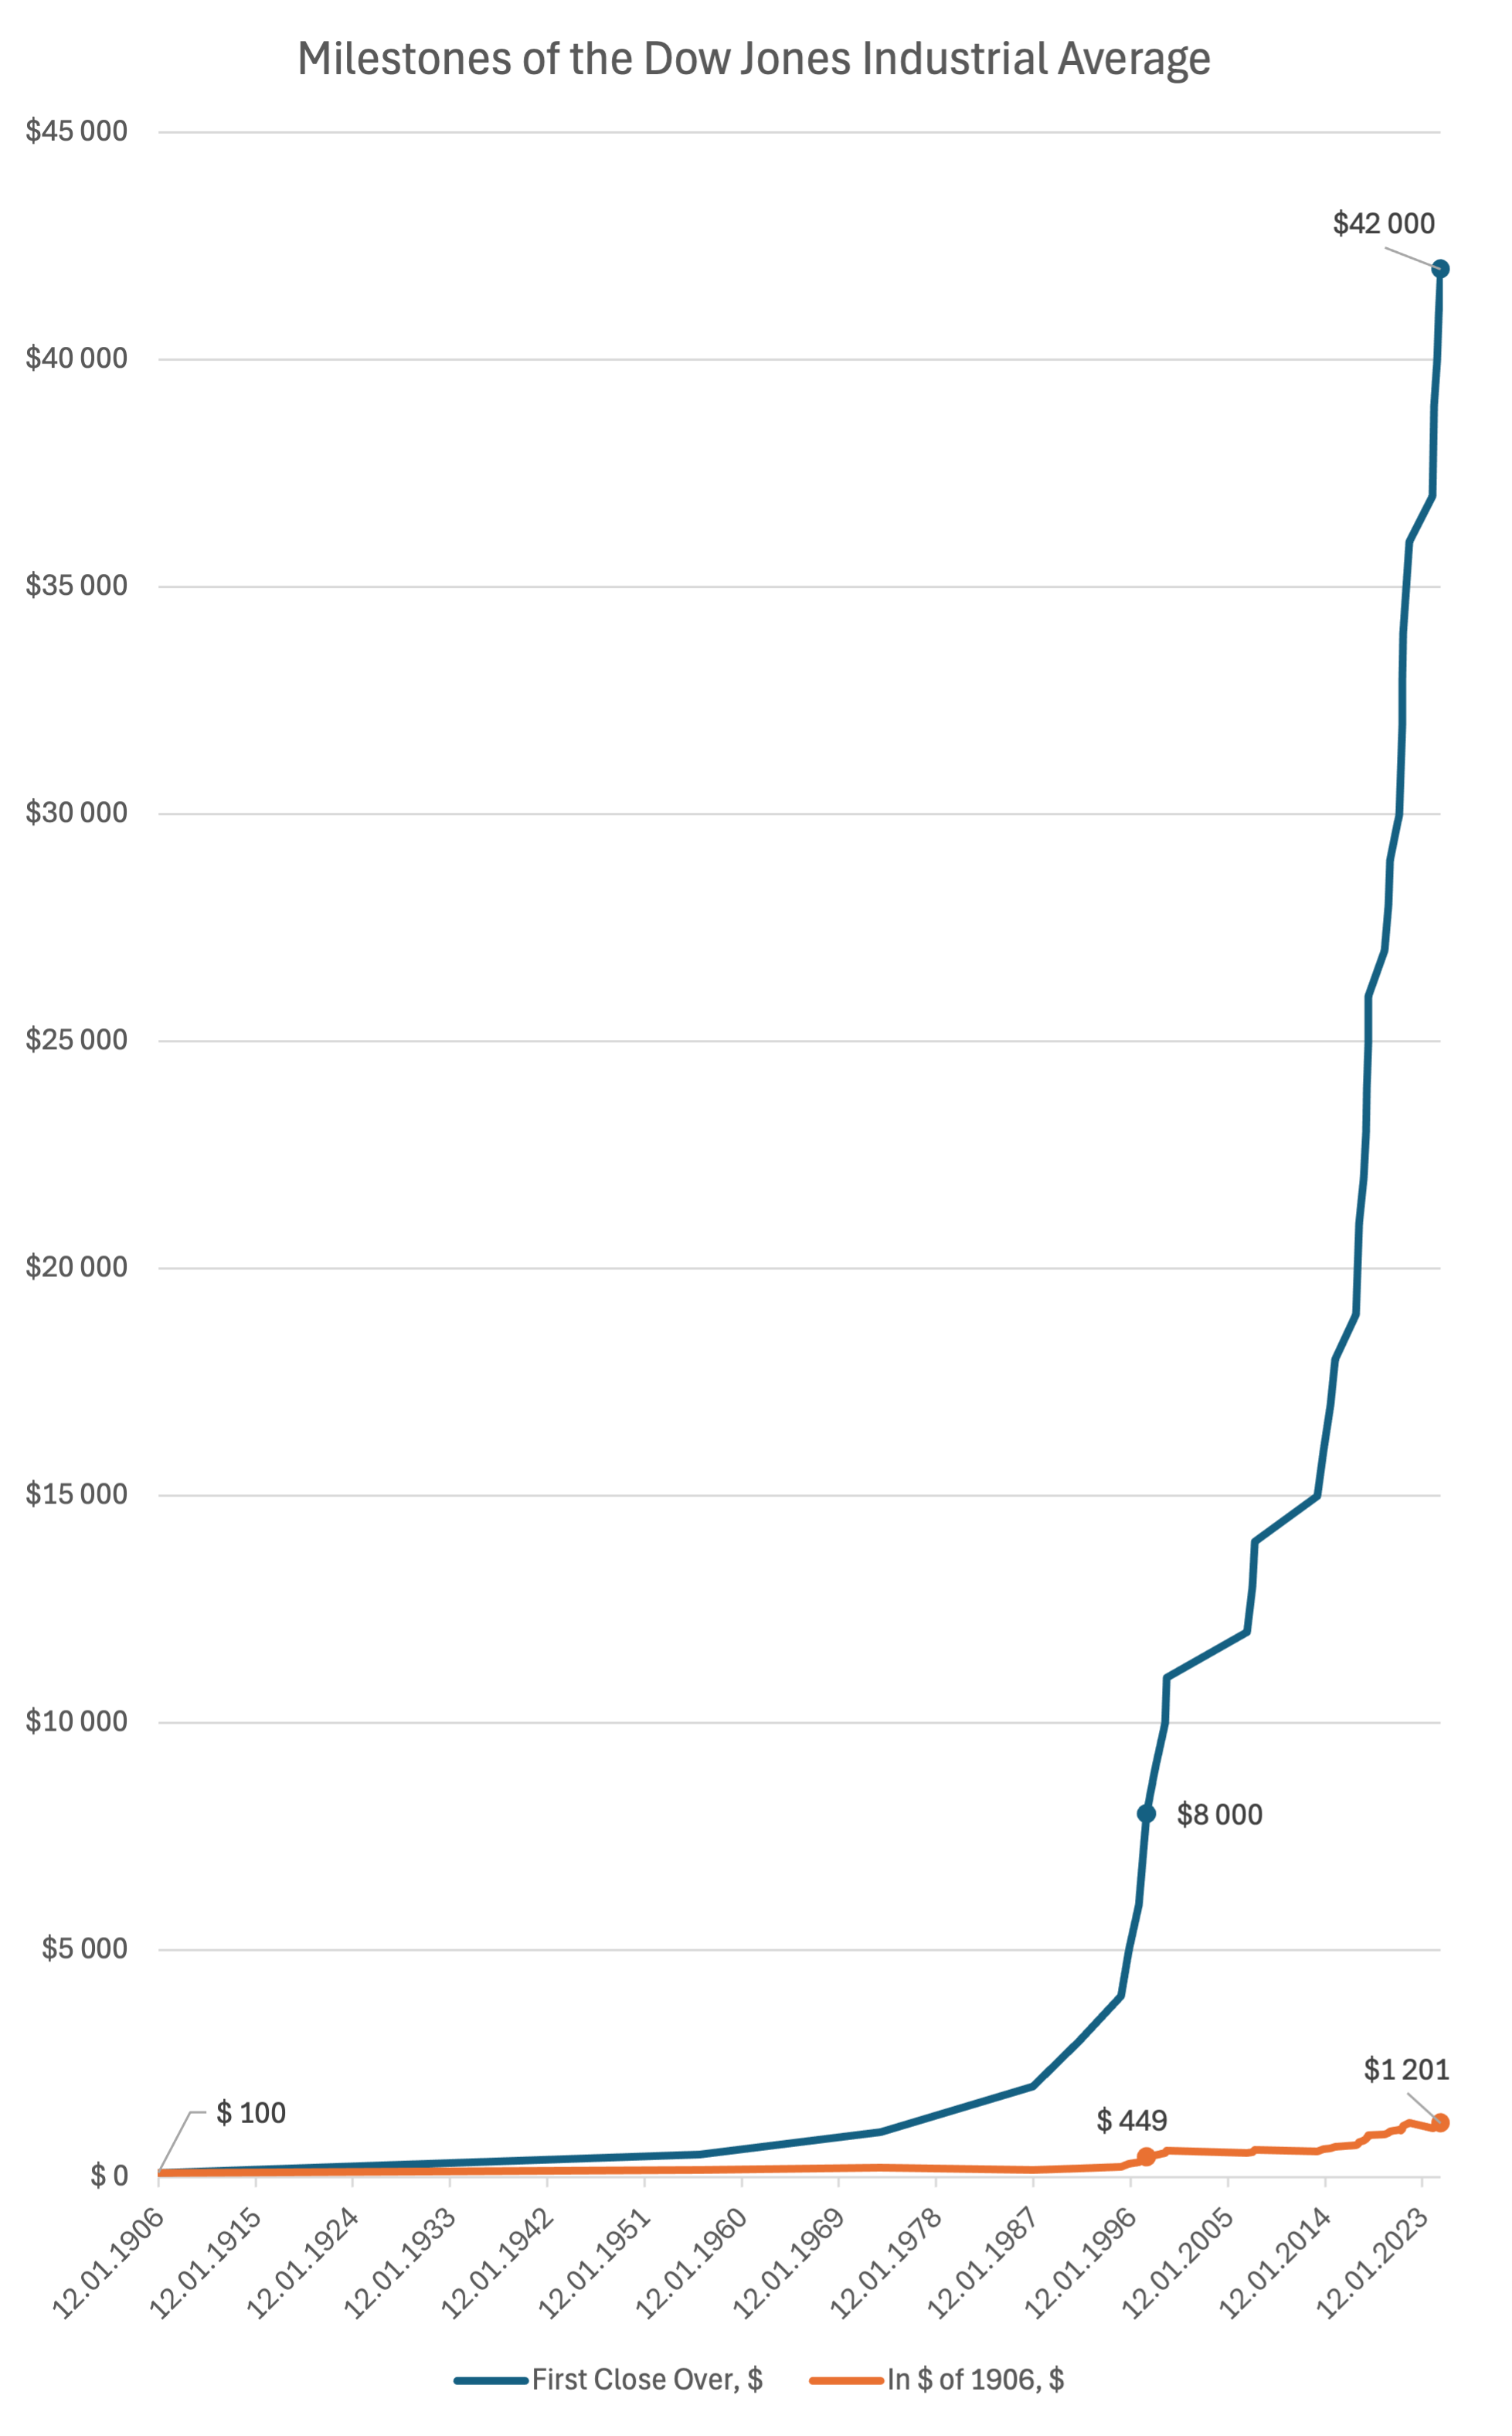
Against the rise of nominal values, real ones may seem to fade, but even they have grown 2.5 times since the publication of the book and the list in 1997. The world has indeed changed significantly.
Have you enjoyed following the changes in the Dow Jones Index? Subscribe to the “So List” blog — there are many more amazing lists and checklists in the world. You’ll also learn how to solve many issues with these simple yet powerful tools.
List of References
[1] Louis Rukeyser from Wikipedia
[2] Wall Street Week from Wikipedia
[3] Louis Rukeyser, “Louis Rukeyser’s Book of Lists: The Best, the Worst, and the Funniest from the Worlds of Business, Finance, and Politics”, ISBN 0-8050-5126-0
[4] Dow Jones Industrial Average from Wikipedia
[5] Dow Divisor from Wall Street Mojo


